Getting Started#
Exposure time to counts#
Given an exposure time, spectral type, and V magnitude, what are the counts and signal-to-noise ratios we can collect using ARCES on the ARC 3.5 m Telescope at Apache Point Observatory?
First, let’s import the packages we’ll use:
import matplotlib.pyplot as plt
import astropy.units as u

from arcesetc import plot_order_counts, plot_order_sn
Then let’s specify the properties of the observation that we’re going to make:
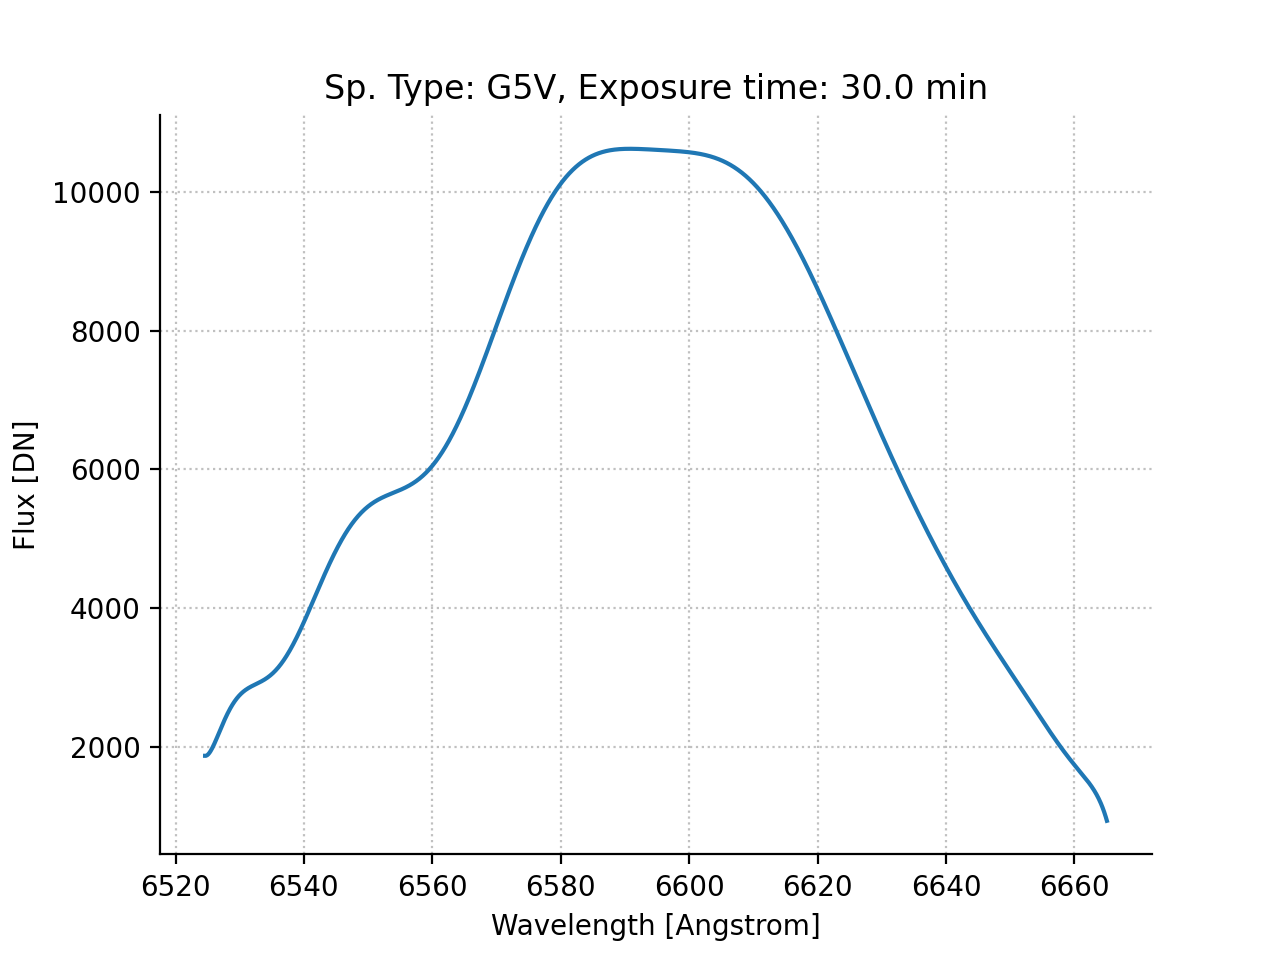
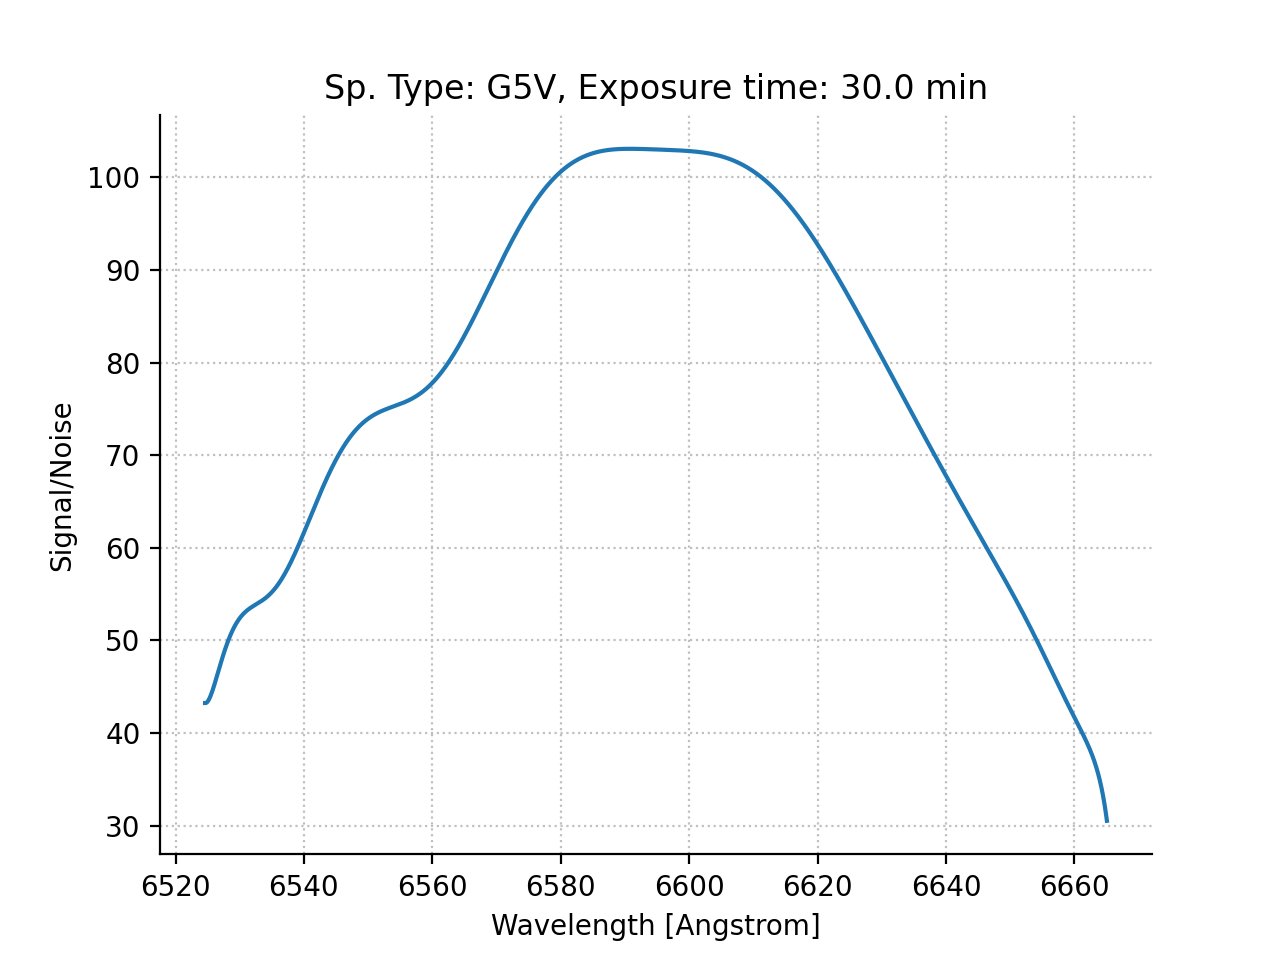
sptype = 'G4V'
wavelength = 6562 * u.Angstrom
exp_time = 30 * u.min
V = 10
Now let’s make a plot of the number of counts we can expect in the order
containing wavelength, using plot_order_counts:
fig, ax, exp_time = plot_order_counts(sptype, wavelength, V, exp_time=exp_time)
plt.show()
(Source code, png, hires.png, pdf, svg)
Similarly, we can plot the signal-to-noise ratio using plot_order_sn
like so:
fig, ax, exp_time = plot_order_sn(sptype, wavelength, V, exp_time=exp_time)
plt.show()
(Source code, png, hires.png, pdf, svg)

Note
The spectral type output by the arcesetc package (G5V) isn’t
exactly the same as the one we requested (G4V). That’s because the
package is giving you the nearest spectral type available in the library of
spectra.
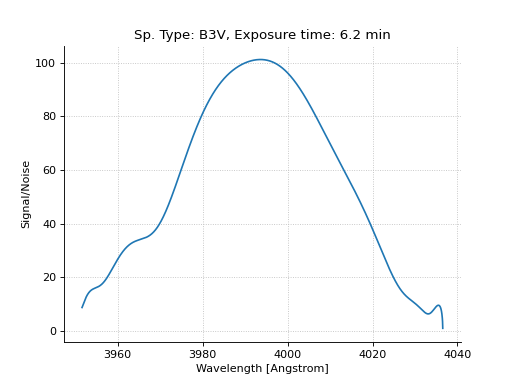
Signal-to-noise to exposure time#
Given a S/N at a particular wavelength, what’s the appropriate exposure time? We
can find out by supplying the desired signal_to_noise, and arcesetc will
compute the exposure time for you:
import matplotlib.pyplot as plt
import astropy.units as u
from arcesetc import plot_order_sn

sptype = 'B3V'
wavelength = 3990 * u.Angstrom
signal_to_noise = 100
V = 5

fig, ax, exp_time = plot_order_sn(sptype, wavelength, V, signal_to_noise=signal_to_noise)
plt.show()
(Source code, png, hires.png, pdf, svg)

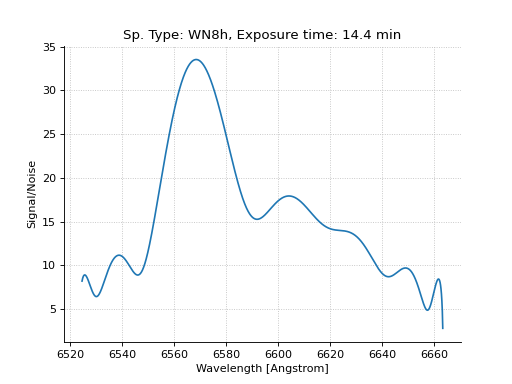
Wolf-Rayet Star#
We presently have one Wolf-Rayet star of spectral type WN8h.
You can see the funky effects of the strong emission lines on the S/N near
H-alpha, for example:
import astropy.units as u
from arcesetc import plot_order_sn

sptype = 'WN8h'
wavelength = 6562 * u.Angstrom
signal_to_noise = 30
V = 14

fig, ax, exp_time = plot_order_sn(sptype, wavelength, V, signal_to_noise=signal_to_noise)
plt.show()
(Source code, png, hires.png, pdf, svg)
